Read on to discover:
- Introduction
- Tool 1: Harnessing Momentum with the 9-Period RSI
- Tool 2: Identifying Price Trends: Bullish and Bearish A-B-C Patterns
- Tool 3: The Universal Trigger: Pinpointing Entries with Swing Patterns
- System Entry Examples
- The Critical Role of the Stop Loss in Risk Management
- Crafting Effective Exit Strategies for Optimal Results
- Let’s Revisit the Previous Examples
- Conclusion: Mastering the Markets with Confidence
Introduction
What if you could trade the financial markets with confidence, knowing your decisions are backed by a proven system?
We are developing a method grounded in probability theory to identify high-probability trade setups. This involves mastering risk management and focusing on trades with favourable reward-to-risk ratios, where potential profits significantly outweigh potential losses.
Our approach centres on recognising recurring price and indicator patterns that have historically led to profitable outcomes. By following a repeatable process, you can grow your account through a consistent system.
The goal is long-term profitability. Learn the patterns, apply the process, and build confidence in your decisions. Mastering this skill provides a structured way to navigate the markets, offering a sense of control and the potential for lasting financial rewards.
In essence, we prioritise low-risk continuation setups on price charts, underpinned by disciplined risk management to ensure sustainable success.
Tool 1: Harnessing Momentum with the 9-Period RSI
Momentum is a cornerstone of our trading approach, reflecting the strength and speed of price movements in the financial markets. By identifying periods of strong momentum, we can pinpoint opportunities where the market is likely to continue in its current direction, increasing the probability of successful trades.
To track momentum effectively, we utilise the 9-period Relative Strength Index (RSI), a widely respected technical indicator. The 9-period RSI measures the speed and change of price movements over a nine-candle period, providing a clear gauge of whether an asset is overbought, oversold, or trending with sustainable momentum. This shorter timeframe makes it particularly sensitive to recent price action, allowing us to capture dynamic market shifts.
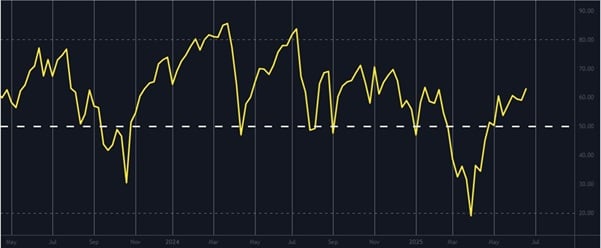
Chart 1
Source: www.tradingview.com
Our method focuses on interpreting RSI signals in conjunction with price patterns to identify high-probability continuation setups. By aligning momentum with our risk management principles, we ensure that trades are entered only when the conditions favour a strong directional move.
Mastering the use of the 9-period RSI equips you with a powerful tool to assess market dynamics. Through disciplined application, you’ll develop the ability to time entries with precision, enhancing your confidence and consistency in the markets.
The 50 Line: A Key Indicator of Momentum Direction
Within our momentum-based trading approach, the 50 line on the 9-period Relative Strength Index (RSI) serves as a critical reference point for assessing market direction. This simple yet powerful threshold helps us gauge whether momentum is tilting in favour of buyers or sellers, guiding our trade selection process.
An RSI reading above 50 indicates upward momentum, signalling that buying pressure is dominant and the price is likely to continue its ascent. Conversely, an RSI reading below 50 suggests downward momentum, where selling pressure prevails, increasing the likelihood of continued price declines. By using the 50 line as a clear dividing line, we can quickly identify the market’s directional bias and align our trades with the prevailing trend.
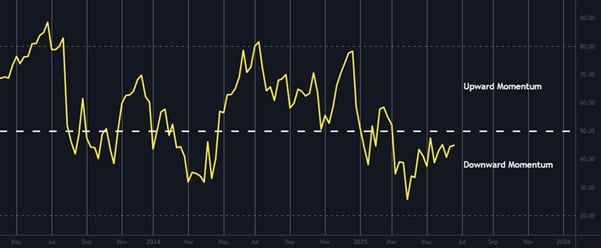
Chart 2
Source: www.tradingview.com
Integrating the 50 line into our analysis enhances the precision of our setups. When combined with our focus on recurring price patterns and strict risk management, this approach ensures we enter trades only when momentum supports a high-probability outcome. Mastering the interpretation of the 50 line empowers you to make informed decisions, reinforcing your ability to navigate the markets with confidence and consistency.
Tool 2: Identifying Price Trends: Bullish and Bearish A-B-C Patterns
A critical component of our trading system is the ability to recognise price trends through distinct patterns that signal directional momentum. Among the most reliable are the bullish and bearish A-B-C patterns, which manifest as zigzag movements on the price chart, providing clear opportunities to align with the market’s trend. These patterns allow us to identify high-probability setups when combined with our momentum indicators and risk management principles.
Bullish A-B-C Pattern
The bullish A-B-C pattern reflects an upward price trend, characterised by a sequence of three distinct moves. Point A marks the start of an upward impulse, followed by a corrective pullback to point B, and then a continuation of the upward move to point C. This zigzag structure-up, down, up-confirms buying pressure and signals a potential continuation of the bullish trend. When the 9-period RSI remains above 50 during this pattern, it reinforces the likelihood of sustained upward momentum, guiding us to enter trades in favour of buyers.
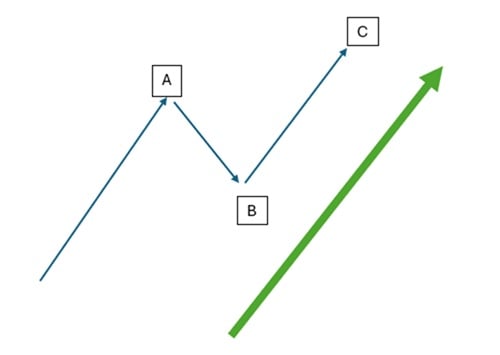
Chart 3
Bearish A-B-C Pattern
Conversely, the bearish A-B-C pattern indicates a downward price trend, following a similar three-move structure. From point A, the price declines sharply, retraces upward to point B, and then resumes its downward trajectory to point C. This down, up, down zigzag highlights selling pressure and suggests further declines are probable. An RSI reading below 50 during this pattern strengthens the case for a bearish continuation, enabling us to position trades in alignment with sellers.
By mastering the identification of bullish and bearish A-B-C patterns, you gain a structured framework to interpret price action. These patterns, when validated by our RSI-based momentum signals and underpinned by disciplined risk management, empower you to capitalise on trending markets with confidence. Through consistent application, you’ll develop the skill to anticipate price movements, enhancing your ability to achieve long-term profitability.
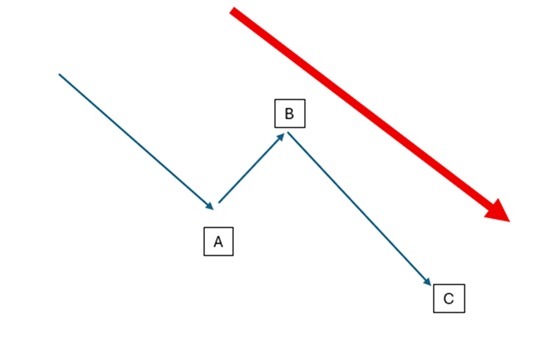
Chart 4
Tool 3: The Universal Trigger: Pinpointing Entries with Swing Patterns
To enhance the precision of our trading system, we introduce the Universal Trigger - a key signal for entering trades within the A-B-C price patterns. This trigger leverages specific swing points during the corrective move to point B in both bullish and bearish A-B-C patterns, enabling us to time entries with confidence. By identifying these swing patterns, typically formed over three candles, we align our trades with high-probability setups, reinforcing our commitment to disciplined risk management and momentum-driven outcomes.
Swing Low in a Bullish A-B-C Pattern
In a bullish A-B-C pattern, the Universal Trigger manifests as a swing low during the corrective move from point A to point B. This swing low is typically a three-candle pattern where the middle candle forms the lowest price, flanked by higher lows on either side. However, the pattern is not considered complete until the last bar’s close is above the pattern’s high, confirming the reversal and the potential resumption of upward momentum. When this swing low coincides with a 9-period RSI reading above 50, it strengthens the case for a bullish continuation to point C, prompting a buy entry. By waiting for this trigger, we ensure our trades are supported by both price action and momentum, maximising the likelihood of success.
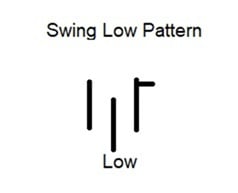
Chart 5
Swing High in a Bearish A-B-C Pattern
For a bearish A-B-C pattern, the Universal Trigger is a swing high during the corrective move from point A to point B. This swing high is also typically a three-candle pattern, with the middle candle marking the highest price, bordered by lower highs on either side. Similarly, the pattern is not complete until the last bar’s close is below the pattern’s low, validating the reversal and suggesting the downward trend is poised to resume towards point C. When paired with a 9-period RSI reading below 50, this swing high confirms bearish momentum, signalling a sell entry. The Universal Trigger ensures we enter trades only when the market’s direction aligns with our analysis, maintaining a low-risk approach.
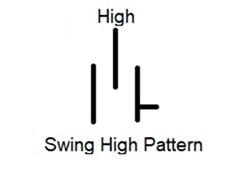
Chart 6
Mastering the Universal Trigger equips you with a refined method to time market entries. By recognising these three-candle swing patterns and waiting for the confirming close - above the high for a swing low or below the low for a swing high - you gain a powerful edge in identifying high-probability trades. When applied consistently within our structured framework, this technique fosters confidence, sharpens your decision-making, and supports your journey towards sustained profitability in the markets.
System Entry Examples
Case Study: Nvidia Chart Analysis
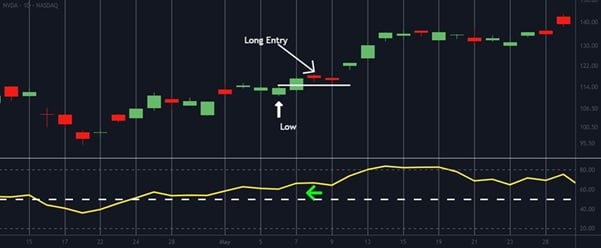
Chart 7
Source: www.tradingview.com
Let’s examine a practical application of our trading system using a chart of Nvidia. A long trade was signalled on 7 May 2025, in accordance with the rules outlined above. However, it’s critical to remember that a setup must fully complete before entering a trade. Although the signal formed on the 7th, the long position could only be executed on 8 May, ensuring alignment with our disciplined entry criteria. Here are the key points to note:
- The 9-day RSI was above 50 (marked by a green arrow), confirming upward momentum and supporting the bullish bias.
- A swing low was established on 6 May (indicated by a white arrow), marking the corrective low during the A-B-C pattern’s move to point B.
- The pattern completed on 7 May with a candle featuring a higher low and a close above the highs of the preceding pattern candles, validating the Universal Trigger.
- Entry into the trade was delayed until 8 May, allowing confirmation of the pattern’s completion and adherence to our risk-managed approach.
This example demonstrates the power of our system when applied methodically. By waiting for the setup to complete and confirming momentum with the RSI, you can enter trades with greater confidence. Mastering this process enhances your ability to capitalise on high-probability opportunities, paving the way for consistent profitability in the markets.
Case Study: Short Trade on Tradu’s USDOLLAR Basket
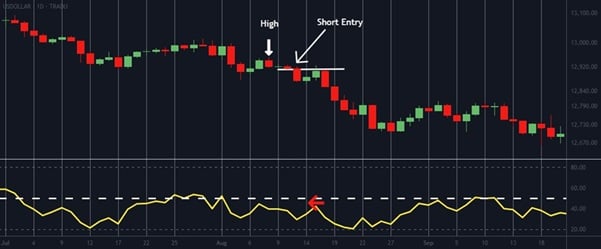
Chart 8
Source: www.tradingview.com
Let’s explore a practical example of our trading system with a short trade on Tradu’s USDOLLAR basket. The short was signalled on 12 August 2024, following the rules outlined above. This setup presented a challenging signal, as it only completed on the fourth day when the close fell below the swing high pattern’s low. Consequently, the trader could only enter the short position on 13 August, a day after the pattern’s completion, adhering to our disciplined entry process. Here are the key points to note:
- The 9-day RSI was below 50, confirming downward momentum and supporting a bearish bias (red arrow).
• A swing high was established on 8 August 2024 (marked by a white arrow), setting the corrective peak during the A-B-C pattern’s move to point B. - The candle on Friday, 9 August, failed to close below the swing high’s low, indicating the pattern remained incomplete at that stage.
- The pattern was finally validated on Monday, 12 August, when the candle closed lower than the pattern’s lows, completing the Universal Trigger.
- This allowed the trader to take a short entry on Tuesday, 13 August, aligning with our methodology and ensuring a low-risk approach.
This example highlights the importance of patience and precision in our system. By waiting for the pattern to fully complete and confirming momentum with the RSI, you can enter trades with greater certainty. Mastering this disciplined process empowers you to navigate complex setups, enhancing your confidence and paving the way for sustained profitability in the markets.
The Critical Role of the Stop Loss in Risk Management
As we refine our trading system with momentum-driven A-B-C patterns, the Universal Trigger, and RSI confirmation, one element stands above all in safeguarding your capital: the stop loss. This essential tool is the cornerstone of our risk management strategy, ensuring that every trade - whether a bullish long or a bearish short - remains within a controlled risk framework. By incorporating a stop loss, we protect ourselves from unpredictable market movements, allowing us to trade with confidence while pursuing long-term profitability.
The stop loss is particularly vital when entering trades based on the swing lows and highs identified during the corrective move to point B. For a bullish A-B-C pattern, the stop loss is typically placed just below the confirmed swing low, ensuring that if the pattern fails - such as when the last bar’s close does not hold above the pattern’s high - we exit the trade before losses escalate. Similarly, in a bearish A-B-C pattern, the stop loss is set just above the confirmed swing high, protecting against a reversal if the market does not respect the downward momentum signalled by the RSI below 50. This precise placement aligns with our methodology, leveraging the three-candle patterns to define risk levels.
Beyond protection, the stop loss empowers you to maintain favourable reward-to-risk ratios, a core principle of our system. By limiting potential losses to a predefined amount, you can target trades where the potential reward significantly outweighs the risk, enhancing the overall effectiveness of our probability-based approach. This discipline ensures that even in the face of an incomplete setup or a sudden market shift, your trading account remains resilient.
Mastering the use of stop losses transforms your trading into a structured and controlled process. When combined with the momentum signals from the 9-period RSI and the precision of the Universal Trigger, this practice fosters a mindset of risk awareness and confidence. Embrace the stop loss as your safety net, and you’ll build a robust foundation for consistent success in the markets.
Mastering Money Management for Sustainable Success
As we build a robust trading system with momentum-driven A-B-C patterns, the Universal Trigger, and disciplined stop losses, effective money management emerges as the backbone of long-term profitability. This critical discipline ensures that your trading account grows steadily, even amidst the inevitable fluctuations of the markets. By controlling the amount of capital risked on each trade, you safeguard your funds, allowing you to weather losses and capitalise on winning setups with confidence. Money management transforms trading from a speculative gamble into a structured, repeatable process aligned with our probability-based approach.
Limiting Risk to 2% with the Stop Loss
A cornerstone of our money management strategy is the rule to never risk more than 2% of your account funds on any single trade. This principle works hand-in-hand with the stop loss to create a protective shield for your capital. The stop loss, placed below the swing low for a bullish trade or above the swing high for a bearish trade, defines the maximum potential loss per trade. To adhere to the 2% rule, you calculate the position size based on the distance from your entry point to the stop loss, ensuring that the potential loss does not exceed 2% of your total account balance.
For example, if your account is valued at £10,000, the maximum risk per trade is £200. If the stop loss is set 20 pips away from your entry, your position size must be adjusted so that a 20-pip move equates to £200 or less. This integration of stop loss and money management ensures that even a series of losses - such as those from incomplete A-B-C patterns or RSI misalignments - does not jeopardise your account’s viability. By maintaining this disciplined approach, you preserve your ability to trade another day, aligning with our focus on favourable reward-to-risk ratios and long-term success.
Mastering money management, starting with the 2% rule, empowers you to trade with resilience and precision. When combined with the momentum signals of the 9-period RSI and the structured entries of the Universal Trigger, this practice builds a fortress around your capital. Embrace this strategy, and you’ll cultivate the confidence and consistency needed to thrive in the markets.
Crafting Effective Exit Strategies for Optimal Results
With our trading system strengthened by momentum-driven A-B-C patterns, the Universal Trigger, RSI confirmation, stop losses, and disciplined money management, a well-defined exit strategy is essential to secure profits and maximise the system’s potential. Exiting trades at the right moment allows you to capitalise on the high-probability setups we’ve developed, while safeguarding the gains earned through our structured approach. A robust exit strategy aligns with our focus on favourable reward-to-risk ratios and long-term profitability, empowering you to trade with confidence and precision.
Exit Strategy 1: 9-Period EMA Crossovers
Our first exit strategy utilises the 9-period Exponential Moving Average (EMA) to guide exits for both long and short positions. For a long trade, consider exiting when the price crosses below the 9-period EMA, signalling a potential loss of upward momentum following the bullish A-B-C pattern. This crossover indicates that the trend may be weakening, prompting you to lock in profits or cut losses as the market shifts. For a short trade, exit when the price crosses above the 9-period EMA, suggesting a reversal of the bearish momentum confirmed by the RSI below 50. This dynamic approach, tied to the swing highs and lows of our Universal Trigger, ensures you adapt to changing market conditions while maintaining discipline.
Exit Strategy 2: RSI Thresholds for Overextension
Our second exit strategy leverages the 9-period RSI to identify overextended conditions, providing a clear signal to exit. For long positions, exit the trade if the 9-period RSI rises above 80, indicating the market may be overbought and due for a correction after the bullish move to point C. For short positions, exit if the 9-period RSI falls below 20, suggesting the market is oversold and likely to rebound following the bearish trend. These thresholds, when combined with the A-B-C pattern completion and momentum alignment, offer a reliable way to step aside before reversals erode your profits, reinforcing our risk-managed framework.
Mastering these dual exit strategies enhances your ability to optimise trade outcomes. The 9-period EMA crossover provides flexibility to track trend shifts, while the RSI thresholds protect against overextension, both working in harmony with our stop losses and the 2% risk rule. Embrace this disciplined approach, and you’ll develop the skill to exit trades with precision, paving the way for sustained success in the markets.
Let’s Revisit the Previous Examples
Case Study Continuation: Nvidia Entry and Exit
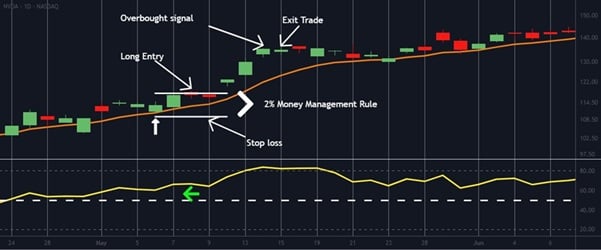
Chart 9
Source: www.tradingview.com
Let’s build on the Nvidia chart analysis from our earlier example, now incorporating a triumphant exit to showcase the full power of our trading system. This case study exemplifies how our momentum-driven A-B-C patterns, Universal Trigger, and disciplined exit strategies work in harmony to deliver exceptional results. By adhering to our structured approach, this trade transforms a well-timed entry on 8 May 2025 into a profitable exit, reinforcing our commitment to risk management and long-term success. Here are the key points to note:
- The entry occurred on 8 May, with the price approximately at 117, following the completion of the bullish A-B-C pattern and Universal Trigger confirmation.
- The stop loss was strategically placed just below the swing low at around 109.50, protecting against a reversal and aligning with our risk-defined framework.
- The difference between the entry (117) and stop loss (109.50) is 7.50 points. To comply with our 2% risk rule, this potential loss must not exceed 2% of the total trading account size. For instance, with a £10,000 account, the maximum risk is £200, meaning the position size must be adjusted so that a 7.50-point move equals £200 or less (e.g., approximately 26.67 units per point, or a position size of about 2,667 shares if trading in whole units, depending on contract size and leverage).
- An overbought exit signal was generated on Wednesday, 14 May, when the 9-period RSI rose above 80, indicating a potential correction after the bullish trend.
- This prompted an exit near 134.60, yielding a remarkable 15.38% gain from the entry price of 117 [(134.60 - 117) / 117 × 100]. This translates to an outstanding risk-to-reward ratio of approximately 2.35:1 [(15.38% gain) / (7.50 / 117 × 100% risk)], showcasing the tremendous profile of this trade when executed with precision.
This Nvidia example illustrates the brilliance of our system in action. The entry, protected by a well-placed stop loss and governed by the 2% risk rule, sets the stage for a profitable move, while the RSI-driven exit at 134.60 locks in a substantial gain. Mastering this process - combining pattern recognition, momentum confirmation, and strategic exits - empowers you to seize high-probability opportunities with confidence. Embrace this disciplined methodology, and you’ll pave the way for sustained profitability in the markets.
Case Study Continuation: USDOLLAR Short Trade
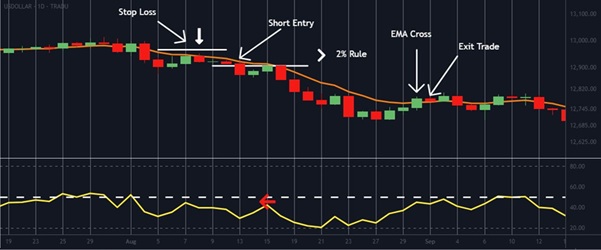
Chart 10
Source: www.tradingview.com
Let’s extend the success story of the USDOLLAR short trade from our earlier example, now unveiling a masterful exit that highlights the full potential of our trading system. This continuation demonstrates how our momentum-driven A-B-C patterns, Universal Trigger, and strategic exit rules converge to deliver impressive results. By adhering to our disciplined approach, this trade transforms a calculated entry on 13 August 2024 into a profitable exit, reinforcing our commitment to risk management and sustained profitability. Here are the key points to note:
- The entry was executed on Tuesday, 13 August 2024, at a price of 12,906.60, following the completion of the bearish A-B-C pattern and Universal Trigger confirmation.
- The stop loss was strategically placed just above the swing high at 12,968.50, safeguarding against a reversal and aligning with our risk-defined methodology.
- The 2% rule dictates that no more than 2% of the trading account may be risked, ensuring that a stop-out results in only a 2% loss. The difference between the entry (12,906.60) and stop loss (12,968.50) is 61.90 points. For a £10,000 account, the maximum risk is £200, requiring a position size adjustment so that a 61.90-point move equals £200 or less (e.g., approximately 3.23 units per point, or a position size of about 3,230 units, depending on contract size and leverage).
- The exit was signalled when the USDOLLAR price crossed above the 9-period EMA on Friday, 30 August 2024, indicating a potential reversal of the bearish momentum confirmed by the RSI below 50.
- The trader exited on Monday, 2 September 2024, at approximately 12,783, securing a notable gain of 123.60 points from the entry price of 12,906.60 [(12,906.60 - 12,783) / 12,906.60 × 100 ≈ 9.58%]. This yields an exceptional risk-to-reward ratio of approximately 2:1 [(9.58% gain) / (61.90 / 12,906.60 × 100% risk ≈ 4.80%)], showcasing a highly favourable profile for this trade.
This USDOLLAR case study exemplifies the brilliance of our system in action. The entry, protected by a precisely placed stop loss and governed by the 2% risk rule, sets the stage for a profitable descent, while the 9-period EMA crossover exit locks in a substantial gain. Mastering this process - blending pattern recognition, momentum validation, and strategic exits - empowers you to seize high-probability opportunities with unwavering confidence. Embrace this disciplined methodology, and you’ll forge a path to sustained success in the markets.
Conclusion: Mastering the Markets with Confidence
As we conclude this trading guide, you now hold in your hands a powerful, structured system designed to navigate the financial markets with precision and purpose. Through the integration of probability-based A-B-C patterns, the Universal Trigger, and the 9-period RSI, you’ve learned to identify high-probability trade setups with upward or downward momentum, guided by the critical 50-line threshold. The disciplined placement of stop losses, aligned with swing highs and lows, combined with the 2% risk rule and robust money management, ensures your capital is protected while pursuing favourable reward-to-risk ratios. Our dual exit strategies-leveraging the 9-period EMA crossovers and RSI overextension thresholds - empower you to lock in profits at optimal moments, as demonstrated in the triumphant Nvidia and USDOLLAR case studies.
This system is more than a set of rules; it is a mindset of consistency, resilience, and mastery. By embracing the repeatable process of recognising patterns, confirming momentum, managing risk, and executing strategic exits, you’ve built a foundation for long-term success. The markets will test your resolve, but with this guide as your compass, you are equipped to weather challenges and seize opportunities with unwavering confidence. you stand at the threshold of a transformative trading journey - apply these principles diligently, refine your skills with each trade, and watch your account grow steadily. The path to profitability is yours to conquer - step forward with boldness and conviction.